Custom Searches
Customising search criteria to enable the delivery of pattern alerts according to your personal requirements is one of the most important steps in your setup process.
Initially using the default settings is an excellent way to start. Most traders will deviate little from these settings, and using the default settings will reveal the greatest number of pattern alerts. However, customised searches allow you to tailor Autochartist to your individual trading preferences, keeping you from having to wade through a sea of unnecessary data.
To reduce and identify the required types of alerts, Autochartist provides certain criteria that may be altered to reflect a trader's particular requirements. For newer traders this process is invaluable because it requires some forethought about the trading process and reduces the number of set ups. A suggestion for all traders is at the very minimum to select the specific markets that are traded most often.
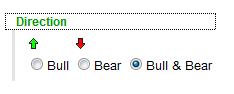 The market direction can be narrowed to show patterns from 'Bull' or 'Bear' markets only. If a certain direction is preferred then the decision to exclude one can be made here. Since most traders do prefer to trade both long and short, the default setting is
'Bull & Bear'.
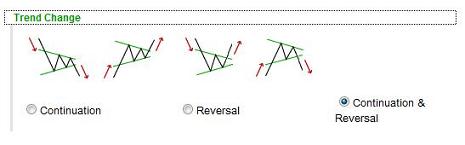
When looking at market direction, the 'Trend Change' filter allows a trader to choose between 'Continuation', 'Reversal', or both. Remember, simply because the pattern may be a 'Continuation' or 'Reversal' pattern does not mean it will necessarily move in that direction to trigger the entry. It is highly recommended that the 'Continuation & Reversal' default setting be kept.
The pattern size or 'Minimum Pattern Length' selection can be adjusted between 20 and 200 candles long. The length which you have selected on the slide will then be the smallest number of candles that form a pattern. Generally speaking, a smaller pattern reflects near-term psychology while larger patterns reflect longer-term psychology.
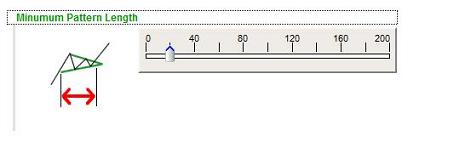
This however cannot be decided upon without considering the time frame itself. A 20-candle pattern on a 240-minute chart is very different to that of a 20-candle pattern on a 15-minute chart, but both are short term relative to their respective time frame.
Keeping the minimum pattern length at the 20-candle default will alert the greatest number of patterns, as the criterion will allow for short and long pattern lengths.
Quality indicators
Thus far the search criteria have been simple and for the most part should be left on the default setting. The next set of criteria, known as the 'quality indicators', are where the more advanced users and traders can be very specific about the patterns they will be alerted to.

There are six quality indicators in total. The overall 'quality' of a pattern alert, as shown in the image above, is a combination of three specific indicators: the 'Clarity', 'Initial Trend', and 'Uniformity' of the pattern, which together offer the most detailed view of what the pattern might mean
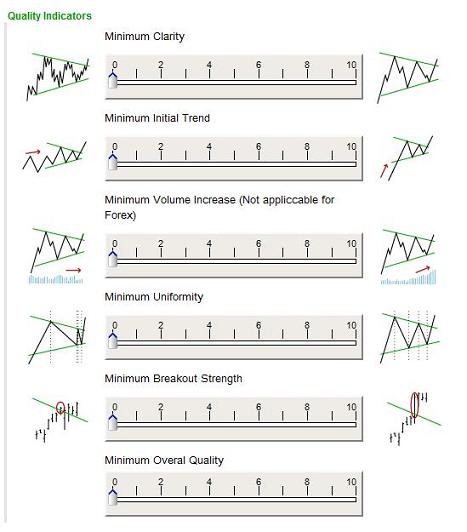
Before making any adjustments, these quality indicators must be fully understood. If low quality settings offer the most flexibility in the alerts, then higher readings will exclude more alerts. If you require a lower number of alerts, begin with the clarity and uniformity readings as these affect both trending and non-trending patterns the same way.
Clarity and uniformity
Sometimes patterns simply look good; that's the aesthetic subjectivity that a seasoned trader often can distinguish between patterns. Clarity and uniformity are the more objective readings of pattern aesthetics, since they reflect a pattern’s price action, support and resistance.
Clarity, as the name suggests, measures how clear and uncomplicated the pattern is – the 'signal to noise', as it were. If there are gaps, random price action, dramatic or sudden highs or lows (also referred to as 'wicking'), the clarity reading will be lower. Low clarity suggests there could be false pattern triggers, also called 'whipsaws'. This is when prices break a pattern but do not follow through and retract back within the pattern, often going in the opposite direction.
Uniformity has to do with the way price action is behaving within the pattern as it applies to the support and resistance of the pattern. A uniform pattern will have even spacing of touchpoints (those highs and lows that indicate support and resistance) within the pattern. If the pattern is uniform, prices will show a similar number of touchpoints at both support and resistance. When a pattern has good uniformity it appears as if price action is filling up the pattern.
Initial trend, volume increase and breakout strength
The initial trend reading indicates the strength of the trend leading up to the start of a pattern, and should generally be kept low. This is simply because trending and non-trending patterns have differing initial trend requirements, and non-trending patterns such as triangles and rectangles can have low initial trend readings. Initial trend readings must be considered within the context of the pattern type itself – for more information on the importance of the initial trend, see Trending Patterns.
The remaining indicators are 'volume increase' and 'breakout strength'. Volume increase is not applicable to Forex but is essentially what the name implies: a measurement of the rise in market participation throughout the pattern.
Breakout strength applies only to patterns that trigger a pattern break as prices pierce support or resistance. If the momentum (as seen by price movement) increases as the pattern’s support or resistance is pierced, this would yield a higher breakout reading. Conversely, less momentum at the point of piercing would yield a lower breakout reading. The lines and levels of a pattern are strong support and resistance, and the break of these lines and levels should accompany more market participation and possibly more follow-through.
Chart Analysis in-depth: trending patterns
Part three of our guide to Autochartist looks at chart patterns which show the market developing in a clear direction, such as wedges, channels and angled flags. Find out more.