Pattern Alerts
Autochartist is a powerful tool which offers traders the capability to anticipate and react to the elements of trend, support and resistance, which form the basis of chart pattern trading.
To help you get the most from Autochartist, take a look at the aspects of Pattern Alerts below. In this section you'll also find more details about Custom Searches, Trending and Non-trending patterns.
Emerging patterns
Emerging patterns offer a proactive trading approach, where the alert appears in Autochartist before price action pierces either the support or resistance of the formation.

You can then filter results depending upon the pattern type, trend, and price action, which helps to minimise the subjectivity in chart pattern trading.
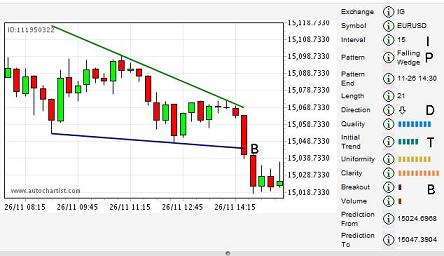
The first thing to note in this alert example is the 15-minute timeframe (I). This can be seen both on the 'interval' line and in the chart itself, where each bar represents 15 minutes. Autochartist can scan 15, 30, 60, 240 minute and daily timeframes.
The pattern type (P) is also listed on the chart, as well as the potential direction (D) of the pattern break. A falling wedge pattern type is a downtrending pattern occurring on the short-term intraday chart of the 15-minute timeframe.
The initial trend (T) indicates the strength of the current trend – for a trending pattern to continue, it is best if the initial trend reading is medium to high. In this example the reading is 'medium', indicating a trend but not a very strong one. The initial trend reading will be one of the most important 'quality indicators' within your pattern-filtering process.
The breakout reading (B) indicates the momentum with which the pattern eventually broke through the support of the wedge pattern (at point 'B' on the chart). The breakout reading is very low, showing little momentum as prices break lower, and thus there will not be a high expectation of immediate follow-through. You should be aware that if the pattern breaks before an economic event, or before a major financial centre like London opens, there could be significant follow-through later.
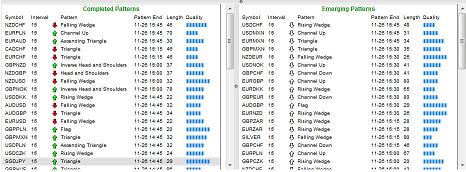
Completed patterns
Completed patterns are listed in the column on the left side of the interface. While emerging patterns are proactive alerts, completed patterns are reactive alerts.
Using the same EUR/USD 15-minute falling wedge pattern alert example now that it is a completed pattern, we can differentiate between emerging and completed patterns through:
- whether or not the price action broke the pattern; and
- the prediction area plotted on completed patterns.
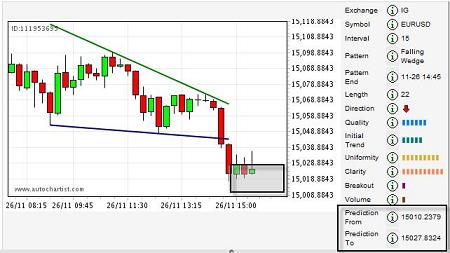
The completed alert shows the grey prediction area (outlined) at the bottom right of the chart, suggesting possible direction of movement after the breakout. On the example above this prediction level is support, since it is plotted below the downward breakout. The other outlined area shows the prices that make up the prediction area, in this case from 1.5010 to 1.5027. The direction of the breakout can either reinforce or weaken the appearance of an ongoing trend, while the completed pattern's prediction area is valuable as an indicator of the market's potential future.
Chart Analysis in-depth: custom searches
Part two of our guide to Autochartist looks at tailoring the software's search facility to target your preferred markets or types of chart pattern. Find out more.