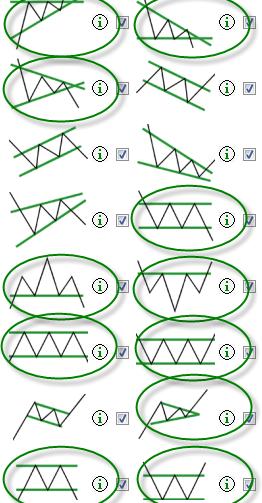
Non-trending Patterns
Non-trending patterns are powerful ways to capitalise on indecision or confusion in the market.
There are two types of sideways markets: accumulation and distribution. The initial trend reading will help to identify this important distinction.
Accumulation cycles are quiet, narrow ranges. Distribution cycles, by contrast, are wider and more volatile while moving within a range; they are also accompanied by a higher initial trend reading.
If the initial trend reading is medium to low, the market is sideways. The lower the reading is, the more likely that it is accumulation; if the reading is closer to medium it's either distribution or a weak trend.
While this process of establishing a trend is not completely objective, there are other ways of validating it such as looking at the pattern's shape and angle to help clarify the market's direction. Knowing what type of cycle you're looking at will help you understand whether resistance and support should be traded with a breakout/breakdown strategy or with a fading strategy.
Trading strategies
Trading with breakout/breakdown strategies is also known as 'momentum' trading. This involves waiting for price action to pierce the support or resistance of patterns such as triangles, rectangles, and pennants. These patterns are best traded when the market cycle is in accumulation and the initial trend reading is low.
To trade a distribution cycle 'fade' – which basically means shorting resistance or buying support – the pattern needs a horizontal support or resistance level. These are often called 'floors' or 'ceilings'. This specifically means that rectangles, ascending triangles, and descending triangles are patterns suited to use of a distribution cycle 'fade'.
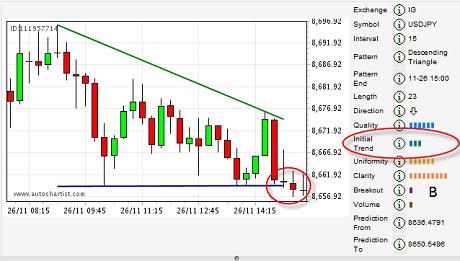
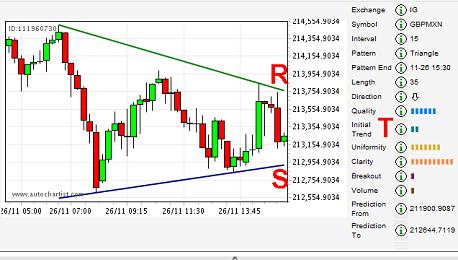
Notice the three bars on the initial trend on this pattern reading. It's not low but it's not medium either. This opens the door to a fade off the horizontal line or 'floor' of the descending triangle pattern.
Not all support levels will hold prices within the pattern. For further confirmation of this you can use key price levels and the breakout (B) reading. Since the reading is very low in this example, the lower momentum at the time of the breakdown suggests that there will be very low follow-through. However, there is always the chance for follow-through so it is recommended to keep a tight Stop-loss (10 to 12 pips) on any fade off a floor or ceiling.
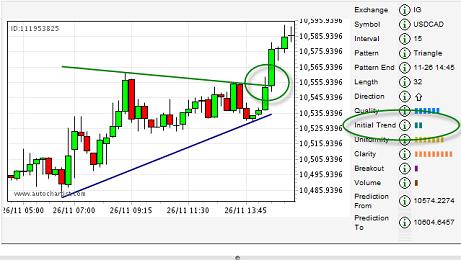
In the above pattern the initial trend reading is relatively weak at two bars. The breakout through the triangle pattern's resistance is seen here following through strongly from the consolidation of the pattern. This example illustrates that there is no way to be 100% sure that a pattern will reverse or follow through. In the end every trading approach needs a solid risk management strategy. Understanding pip movement and volatility at the time of entry and throughout the position is the first step, best taken by considering the pattern's timing together with economic data releases.
Setups and entry strategies
If a trending market shows an imbalance between buyers and sellers, a sideways market reveals the balance between supply and demand. You have to wait for a shift in this balance to find the entry point, as prices pierce the support or resistance of patterns such as triangles and rectangles. Keep in mind that there are two potential entry scenarios for non-trending patterns, depending on whether the market is in distribution or accumulation.
There are some simple cues to focus on which can help you quickly determine whether you're seeing a momentum entry or a distribution fade entry.
First and foremost must be the pattern itself. Distribution fade entries rely on a horizontal ceiling or floor, allowing you to sell from resistance and buy from the floor. This means that rectangles and ascending/descending triangles are the patterns you should be looking for as potential fade setups.
The initial trend reading for this setup should ideally be medium. If it is low, this indicates an accumulation set up. If it is high, the underlying market cycle is most likely trending. Try to confirm this with a view of the live chart.
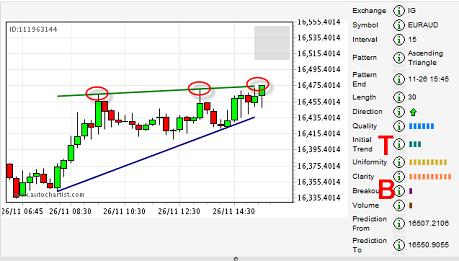
In this example, the resistance is angled slightly upwards but effectively horizontal, giving us an ascending triangle pattern. Note the three-bar initial trend (T) reading, barely high enough to signal a potential distribution cycle. One or two bars more would have been better. Also note the very low breakout (B) reading, suggesting minimal potential for upside follow-through.
The resistance level here could be shorted. All fades are aggressive setups and the validity of the short extends only 10 to 12 pips beyond the highest point of the ceiling. In this way if there is momentum beyond the ceiling, the aggressive fade can be reversed and the momentum bought.
The more conservative entry is to anticipate and react to the momentum as prices break through the support or resistance of a sideways pattern. This is an accumulation cycle setup and is ideal for markets where the volatility is low and the range narrower.
Think of this setup as a 'coiled spring' ready to release. As the spring coils it stores energy until it unloads all that energy. The more it is compressed, the more potential energy on release. This is how accumulation markets work.
Momentum setups must be traded in an unbiased way. This means that the trader should anticipate a break in either direction since there is no trend. Visually it is ideal to see a narrowing range in the price action.
Building momentum
Triangles and pennants by their very nature are self-limiting patterns. If prices do nothing else but move sideways within the pattern, they will eventually run out of room. When the pattern narrows, that's where the breakout can be expected - a simple indicator like a MACD Histogram could be used as a directional filter for the break.
Remember the coiled spring. If prices break too early within the triangle there is a chance that the market may be in distribution. The coiled spring works for rectangle patterns too. Even though rectangles, as well as double and triple tops and bottoms, are parallel and/or horizontal line patterns, the range of the pattern can show how much potential energy the coiled spring is storing.
Narrow ranges work very well for momentum breakouts and breakdowns while wider ranges are more suitable for distribution fades. Again be sure to check not only the initial trend but also the actual range of the pattern to see if there is a spring being coiled.