Trending Patterns
For all trading styles understanding the trend of the market is key. To get the most effective chart pattern set up the direction and strength of the trend must be known.
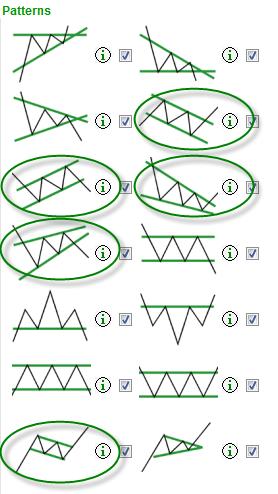
There are basically two types of chart patterns: trending and non-trending. Trending pattern types on the Autochartist platform are rising and falling wedges, channel up and down patterns, and those head and shoulders patterns which feature steeply angled necklines. Some flag formations can also be considered trending patterns, if the tilt of the flag is steep enough.
For the most part, however, flag formations and head and shoulders patterns are generally considered non-trending, and can be found and traded in other market cycles. Wedges and channels are strictly trending patterns, and should be set up ideally with medium to high initial trend readings.
Wedges and channels reveal the psychology of a trend in terms of the lines and levels that shape them. The lines and levels in these are either a pair of uptrend lines or a pair of downtrend lines.
In trending wedges and channels, the lower (supporting) line of an uptrend is the backbone of the pattern and is considered a 'decision level', since the formation relies on continued support. Conversely, with a downward trending pattern it is the upper line (resistance) which keeps pushing prices lower.
Let's look at examples of both uptrending and downtrending patterns.
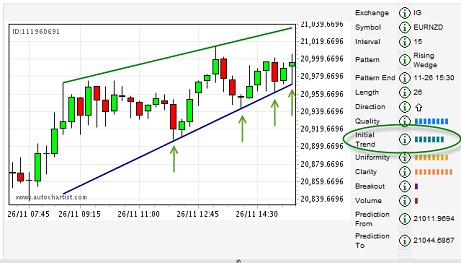
This first chart is an uptrending rising wedge pattern, as prices trend higher with a strong initial trend reading. The support or 'backbone' of the pattern has been tested four times as prices traded down to the uptrend line support, confirming the pattern's quality. The high initial trend reading suggests that the pattern is developing as part of a larger trend.
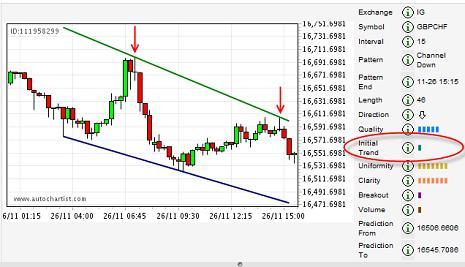
Next is an example of a downtrending pattern, which shows a very low initial trend reading. Not all trending pattern alerts will have a high initial trend, because the lines and levels that form a pattern can develop within any market cycle.
Identifying patterns as they form
The customization of alerts makes provision for traders with different tolerances for the strength of a trend. Just because a pattern isn't a perfect pairing for the underlying market cycle does not mean that the lines and levels are without merit! In this case, the downtrend line resistance could be very helpful to identify a breakout to the upside.
However, because the initial trend reading is low, the underlying trend is likely to be weak or not even a trend at all. This would mean that a better pattern to keep an eye out for would be a triangle or rectangle.
There are several potential entry points on any trending pattern, in order to take best advantage of the predicted pattern of market movement. Which action to take depends to a certain extent on the strength or weakness of the initial trend.
High-trend and low-trend patterns
For high initial trend readings, look for the continuation of the trend and capitalise on the follow-through. Either short the downtrend line resistance of a falling/down pattern, or go long on the uptrend line support of a rising/up pattern. Since they take advantage of corrections within the trend, these actions would be considered 'swing' entries. The other alternative with patterns showing a high initial trend is to capitalise on the breakout, which would be considered 'continuation'.
With patterns showing low initial trend readings, and where the bars are medium, look for a potential stall or reversal of the trend where the 'backbone' may be broken as the trendline is pierced. Even though these are likely scenarios, remember that any initial trend reading could lead to a continuation or reversal.
Setups and entry strategies
As already mentioned, trending patterns include rising/falling wedges and channels up/down. These continuation patterns are ideally traded when the market is uptrending or downtrending, and when the initial trend reading is medium to high. Continuation entries can be swing bets off downtrend line resistance or uptrend line support. They can also be downward breakout entries when the trending momentum is very strong and the market offers little to no correction.
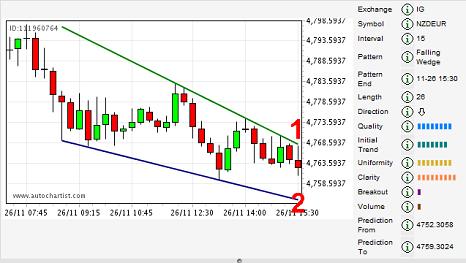
The falling wedge pattern in this example has a high initial trend reading which indicates a potential continuation setup. The uniformity and clarity are very strong, suggesting the pattern's price action will be more reliable and less prone to whipsaws and random volatility. Keep in mind that the time when this pattern has developed is important as well. If there is a pending economic release there is a high possibility of increased movement.
The two primary entry considerations are:
- the short at the resistance line (1), which would be a corrective or 'swing' short
- the support line (2) downward breakout, which would be a continuation entry.
Since the initial trend is strong, the reversal would not be a primary trade consideration. Follow the trend. The trend is your friend, especially when the initial trend is high. Here it appears as if the price could trigger the swing short (1).
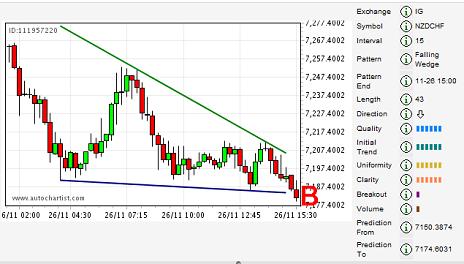
If the initial trend is strong but there is no correction, look for the downward breakout play (B) as prices push through the supporting level.
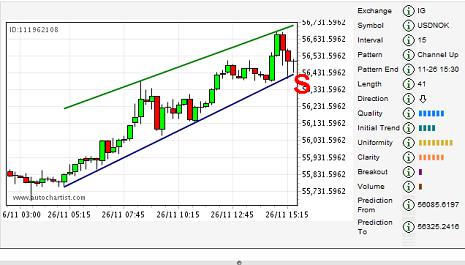
When the initial trend is medium it is important to proceed with caution. Remember there still is some trend strength so there is the chance of a corrective or 'swing' entry. The backbone of the pattern however could be tested and broken. In this case, the backbone or decision level is the support line (S). When the initial trend is medium there is less chance of momentum on the continuation breakout.
When the initial trend is low (less than medium) but there is a trending pattern, it's probably best to look for a non-trending pattern alert instead.
Chart Analysis in-depth: non-trending patterns
The final part of our guide to Autochartist looks at chart patterns in which the markets trade sideways, forming part of accumulation or distribution cycles. Find out more.