Applying TA to Leveraged Trading Scenarios
One of the great advantages of technical analysis is that the theory can be applied over a range of different timescales, from long term investment to leveraged day trading.
Support, resistance and trend lines can be identified, and applied on intraday stock and futures charts as readily as they might be on a ten year chart of an index. Due to the shorter term nature of leveraged trading, some techniques will be more favoured than others and indicator periods (moving averages, RSI and other) will tend to have a shorter sample period than would be the case for longer term investment.
Typically, leveraged trades will be over shorter time frames than buying outright, due to the cost of borrowing the money to obtain that leverage. A typical spread betting firm with charge LIBOR (London Inter Bank Offer Rate) +2% or 3%. At the time of writing, that can amount to 8% per year, meaning that you have to gain 8% on the trade per year just to break even. However, if these same trades can be completed over a shorter time period, say days or weeks, the cost of funding will have a much lower impact on the P&L, and may be negligible.
This cost of funding effect can be seen on United States Oil Fund (see chart).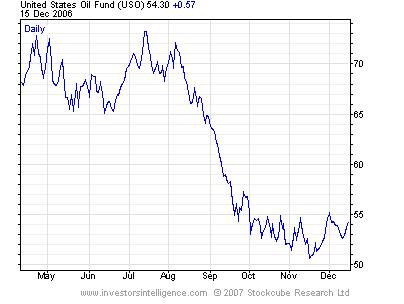 This ETF does not physically hold barrels of oil, it is a constantly rolled over long contract. Having started its life as the equivalent of one barrel of US Crude Oil in April 2006, this constantly rolled position is now trading under $55, whilst US Crude Oil now trades at $62 to $63.
When using leverage, losses of greater than the initial margin put forward can be suffered, so care should be taken with the position size.
The following steps should be taken to determine the correct position size:
- Determine the stop loss point on the chart; the point at which the position is cut because it is going wrong
- Decide on a maximum tolerable loss as a percentage of trading capital. No more than 10% of trading capital should be risked on one position. Some would say that percentage should be 2% or 3%.
- Then, the position size is given by the above variables.
Position size = Total Trading Capital X Maximum allowed %age loss/Distance from opening of position to stop loss
Determining the stop loss
The stop loss has to be far away enough to represent a meaningful technical change to the chart action. In many cases, this will mean a break of support on a long position. This could be a long, medium or short term support level. If stop losses are too close, you are likely to be continually stopping yourself out on market noise. Basically a hostage to fortune!
It is better if the stop loss represents a clear technical change from previous action. For example, the 200 day moving average on the Dow Jones Composite Index has provided support during this bull market.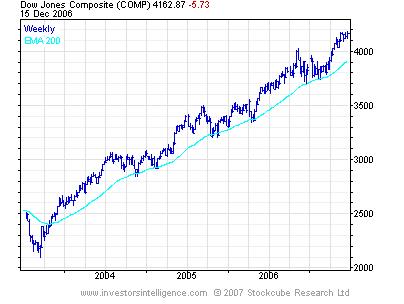 Even where the moving average was broken, it did not stay broken for long enough to turn down. Therefore a stop loss for a long term investment in this broad index could be a weekly close below a falling 200 moving average. This would signals a defined change in investor sentiment.
The scenario illustrated above could involve a fair sized draw down and would not be suitable for short term positions. We are now going to look at a theoretical shorter-term trade in British Airways (see chart).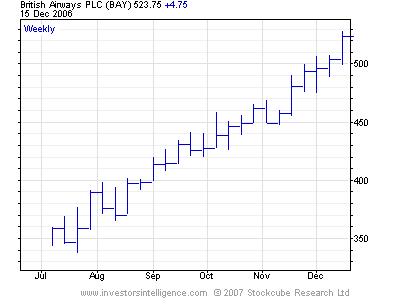
Here, we have a stock that has recorded an orderly sequence of rising weekly bars and traders can utilise this pattern to jam the stop loss up underneath the price bars, locking in profit as the uptrend progresses.
At the time of writing, a weekly reversal below the low of the last week shown (perhaps at 497p) would represent a meaningful change for a chart that had advanced in a straight line since the summer. There is also a case for a daily reversal being taken as a sell signal. This would lock in a higher proportion of profit, in which case, a close below the last intraday low of 515.5p would used (see lower chart).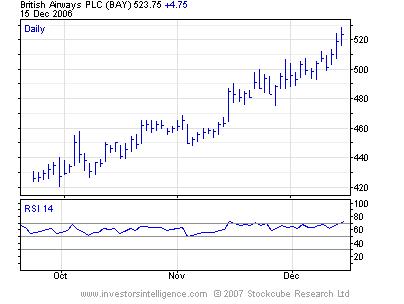
In truth, there is no ‘correct’ answer to stop levels, it is a question of risk tolerance and how active a trader you wish to be. Wider stops should be used for investment positions than trading position but stops on successful investment positions can be raised after a good run.
Targets
Some traders avoid targets, arguing that they place a cap on potential profits. This is a fair argument and the old adage of run your profits should not be ignored.
Obvious targets are previous support and resistance levels, particularly when the stock is range bound. When using these it is often wise to set your target a little before the level, leaving some room for successful execution.
Other targets can be estimated from various measurement techniques, often based on the height of reversal patterns. For example, the height of the head & shoulders bottom formation for the S&P500 2003 to 2004 was approximately 190 points.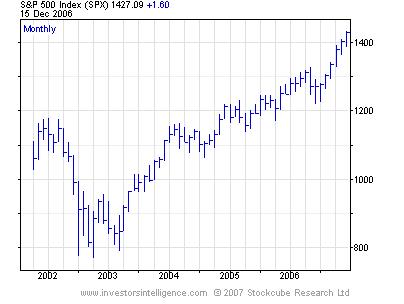 That could be added to the breakout point of the formation in spring 2003, which gave a target of 1,140. The index achieved 1,163 in March 2004 before having a reasonable sized correction in price and time, so the target was not too far out. Targets are never intended to mark the ultimate top (or bottom).
Targets should not be taken too literally. Instead, they can be used in conjunction with the stop loss position to calculate a risk to reward ratio. The trader should look for a reasonable expectation of potential reward to be double the risk implied by the stop loss for a trade to be worth taking on. Some people say that reward should be three times the risk before the trade is accepted. In practise, that can be hard to achieve. The stop loss can be bought closer to get to the magic three, but this can often involve moving it within the normal ‘noise’ of the market and being stopped out by something without technical justification.
Example: US Light Crude Oil
Crude oil traders are looking at the potential base being formed over the last quarter of 2006. We will assume that the trader will only buy on a breakout above the base formation at $65. 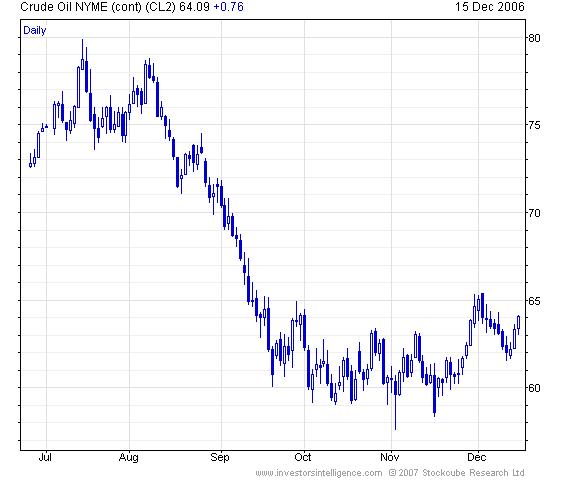
Is this worth buying from a risk/reward perspective?
The reward, based on the height of the base formation is $65 minus $57.57 (the intraday low) = $7.43, giving a target of $72.43 once added to the breakout point at $65.
A reasonable stop loss would be below the potentially higher low in early December, perhaps at $61.
Buying now (at $64.09): Risk = $3.09 Reward = $72.43 - $64.09 = $8.34 Reward: Risk = 2.7
Buying at the breakout (say at $65.15) Risk = $4.15 Reward = $72.43 - $65.15 = $7.28 Reward: Risk = 1.75
So the trade can only be justified now on a reward to risk ratio, but that is only if the current chart, before the base breakout, is acceptable. Obviously, confirmation would be preferred but this always involves deteriorating reward: risk and in practice, even a 2:1 ratio is hard to achieve with full confirmation.
Trading with, or against, the trend?
Given that the main concept in technical analysis is trend, it is surprising that many traders attempt to trade against the trend. They do this because there is much greater satisfaction to be gained from picking an exact turning point than in buying halfway along a trend. The chances of success, however, are slim however. During a downtrend, every person that has bought since the last high has been picking the low and has been wrong. Meanwhile, all the people that have bought during a long uptrend have been correct, whilst all of the sellers have been wrong (except those that really needed the money!).
We return to a chart shown in an earlier chapter.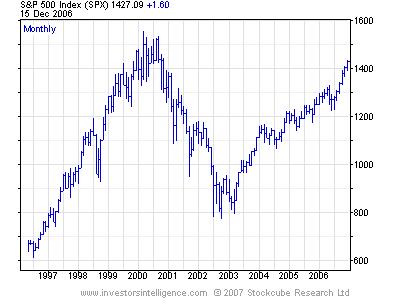 This shows that there have been three major trends in the S&P 500 Index in the last 10 years, meaning that a long term trend following strategy should be employed. Within this, we have a variety of tools such as momentum and breadth indicators to reduce the possibility that we are buying at the exact high. Easy!
Six Golden Rules
This bring us to the end of this series of articles about trading with technical analysis. Remember, charting, and indeed all other forms of analysis, has no power to predict the future. However, technical analysis does provide a map of the financial markets allowing the user to study historical behavioural patterns, and thus identify, formulate and manage trades accordingly.
Here are six golden rules for trading with technical analysis that we use at Investors Intelligence. I hope you find them helpful.
- Trade the trend not the countertrend - look at the long term chart first
- Consider commonality and index direction – do not always attempt to buck the general trend
- Let the chart determine the tactics – direction, time, expectations
- Volatility: High volatility, smaller position – the market dictates the style and size of trade
- Protect unrealised gains with trailing technical stops – avoid meaningless financial stops ( 5%, 10%, etc)
- Be cautious with your use of targets- they may limit your gains, and you will need them!
Good luck!
John Ritchie, MSTA
Technical Analyst
Investors Intelligence
December 2006