Support, Resistance and Other Price Patterns
The concepts of support and resistance are integral to the previous discussion of trend.
Support is a level of prices where troughs are formed on price charts, where buying interest is significant to overcome selling pressure. Resistance is obviously the opposite.
These levels represent markers in our monitoring of the progression of a trend. Moreover, there are reasons why a previous support or resistance level may come into effect again. These are due to the psychological reaction of market participants to price reaching previous levels. For the chart below, we will consider three groups of market participants; the longs, the shorts and the uncommitted. We will start our story with the construction group Balfour Beatty (BBY), a stock progressing higher in the summer of 2006.
Moving from left the right on the chart, we observe the peak at point (A) as the price of BBY fails to progress above this level in early August. At this point sellers moved in, taking a profit and forcing the price lower. However, this proved fairly short lived and buyers soon moved back into the stock, taking us back to the 370p level. Here we saw the stock hesitate for a few days. 370p was the level where sellers had moved in before, and this proved to be psychological barrier. Investors were unwilling to pay up beyond this level, and sellers who missed their chance last time had another opportunity. This is how resistance forms.
The next move on the chart shows price action pushing on up through this resistance level. The buyers have won the day in the battle between supply and demand. What happens next is interesting... the stock retraces on the countertrend, but pauses its decline at the previous resistance level. Why should this be the case? As ever with markets, it is basic human behaviour at work. Investors who may have initiated shorts at the previous resistance now have a get out of jail free card. They close out shorts, creating demand.
Of those that have no position, some have closed previous long positions at (A) or (B). Having seen prices move higher and regretting closing their position, they now have the chance to re-enter without paying extra. Other uncommitted people, having seen the market move higher, have resolved to buy the next dip.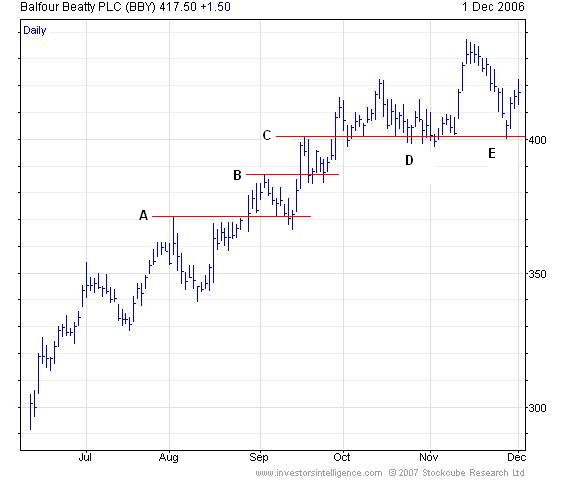
A repetition of these behavioural patterns is seen at (C). As with the previous examples of support and resistance, these levels are broken or tested a few times, generally on an intraday basis. It pays not to be too exact about support and resistance breaks. Better to consider regions of support and resistance.
At the end of the chart there is an example of support recurring. Here are some of the groups of market participants (traders, investors etc) that might be driving this price action:
1. Holders wishing to add to purchases made at (D)
2. People who wished they had bought at (D)
3. Or wish they hadn’t sold at (D)
4. Those that went short at (D)
All of the above groups have the opportunity at (E) to achieve their aim or make up for their error.
The above scenario may seen a bit contrived and it is true that charts do not always work out quite as neatly as the example shown, but it is clear that on the pullbacks to prior resistance in an uptrend, a number of market participants have an interest in buying the stock.
The sense of regret of those on the wrong side of the market may be easier understood in the context of downtrend. Imagine that lots of people had bought at a price level repeatedly and that level came to be seen as support. Then, for whatever reason, this support level is broken. On the first recovery to that support level, you can be sure that many holders will be relieved to be able to sell out at break even, with that selling pressure limiting the advance of the market.
The significance of a support or resistance level varies with certain factors. The more trading that has taken place at a level (determined either by time period or volume traded), the more people have a vested interest in that level. The more people that had bought at price support, the greater the selling pressure on the recovery following a break.
Time can be a healer. Traders are more likely to react to recent price action as the regrets and hopes are fresher in the mind. The degree to which a level has been penetrated can also effect the psychological reaction. A deeper break of support, followed by a recovery will likely bring a greater sense of relief (to those that own the stock) than a smaller break of support. Therefore they are more likely to conclude that they were wrong and to close out at break even.
Round numbers can also form support and resistance because they represent landmarks for a market. This is purely psychological; it has nothing to do with fundamental value.
John Ritchie, MSTA
Technical Analyst
Investors Intelligence
December 2006